
Implementation of a PV installation in the Hysopt software
For some projects the client wants to know what quantity of electricity of the PV installation can be directly consumed by the heating installation, for example with heat pumps. If the PV panels are already installed, it is possible that the consumption of these panels is monitored and could be extracted into an Excel file. Figure 1 shows the needed setup for a simulation model of a PV installation. The data of the production of the PV installation is connected to an electric meter box. The electric meter box will capture all the electricity consumption of the linked components in simulation and the electricity production of the PV panels. It is also possible to connect an additional data file with the electricity consumptions of other equipment within the building, for example lighting. All this data will be displayed in the transient plots base circuit (BC).
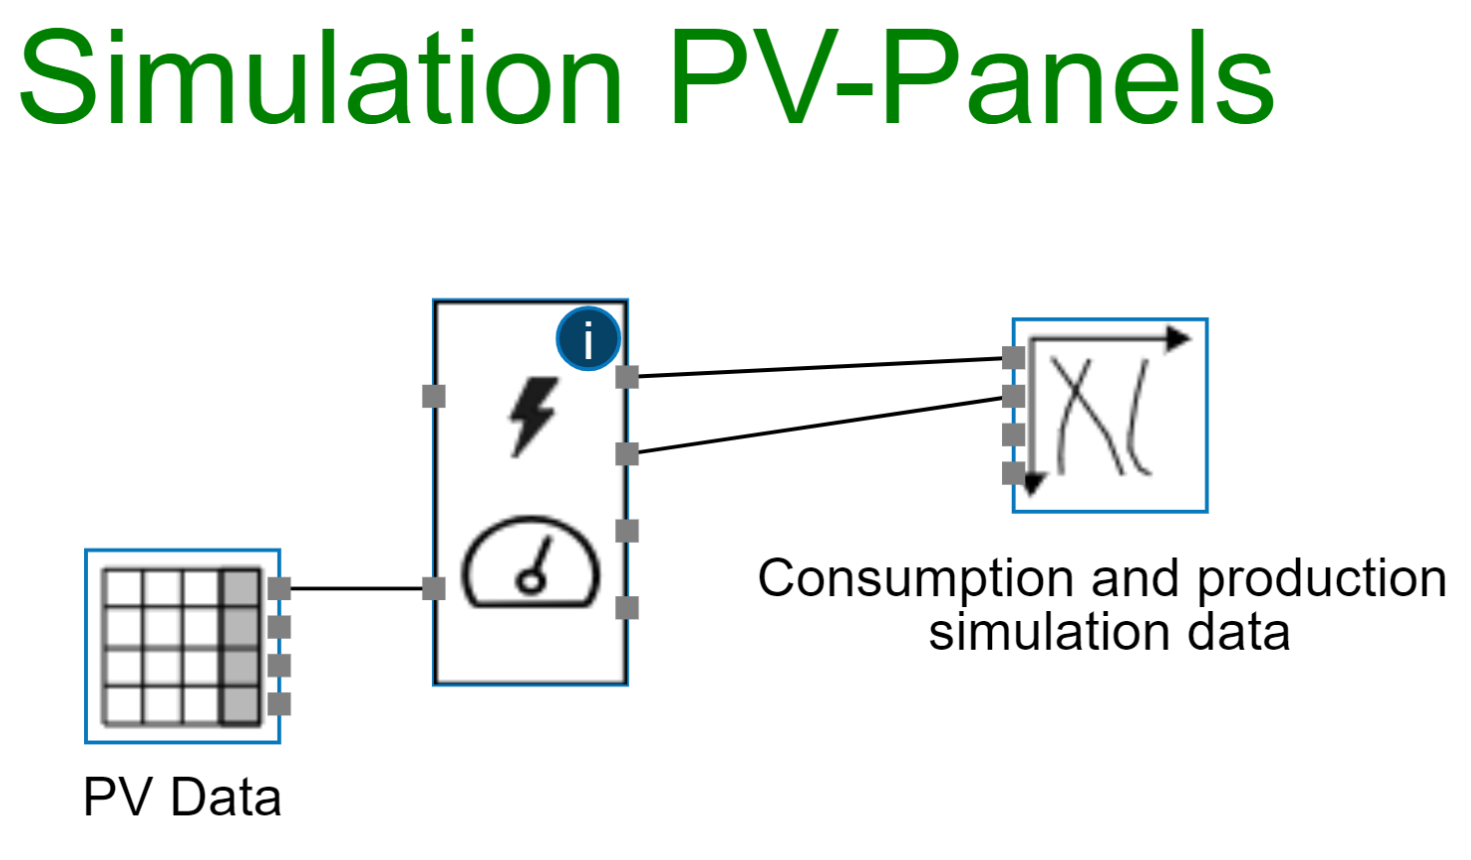
Figure 1: Setup for simulation model of a PV-installation in the Hysopt software
In practice, you will find this data isn’t often available. Discussed in the section below is a way to make an estimation with data.
Calculation tool for performance of grind-connected PV panels
In case of lacking production data of the PV installation, you can use this online tool based on the research of the EU Science Hub on behalf of the EU Commission. This tool can be used to estimate the average monthly and annual energy production of a grid-connected PV system without battery storage. The calculation takes into account solar radiation, temperature, wind speed and PV module type. Figure 2 shows the layout of this tool, where u need to fill in the parameters of the PV-installation. The user can choose how the modules are installed: free-standing on a rack or integrated into the surface of the building. In case of unknown (PV installations that aren’t build yet) tilt and orientation of the panels, this tool can calculate the optimal values for these parameters that will maximise annual energy production. If the calculations are finished you can easily export this data into a csv-file a put it in the Hysopt software.
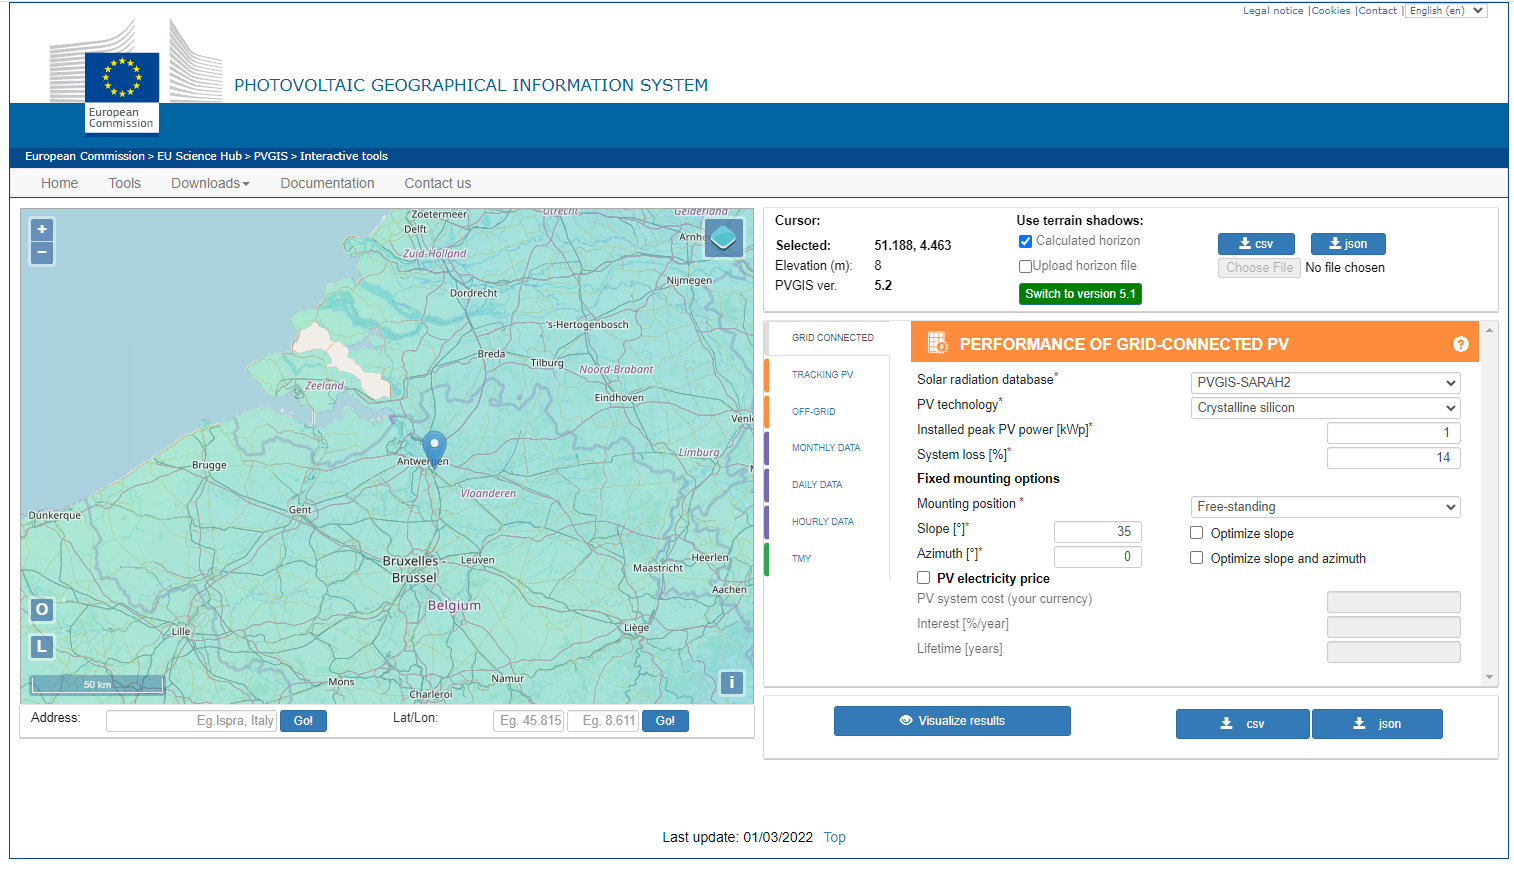
Figure 2: Calculation tool for performance of grind-connected PV panels