
The graphing tools are used to visualize different parts of the control strategy or give
|
|
Name |
Description |
|---|---|---|
|
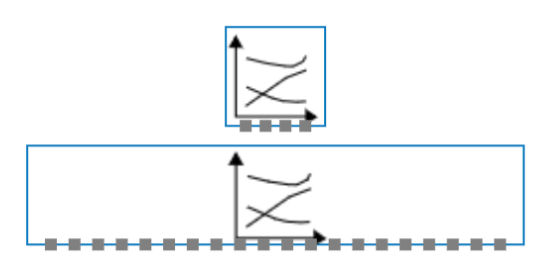
Transient plots |
Transient plots plot out all the inputs on the Y-axis. |
|
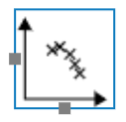
Scatter plots |
Scatter plots can plot one value on the X, the other value on the Y-axis |
|
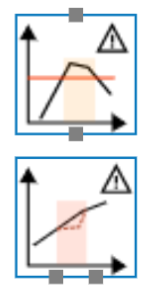
Threshold notifier and comparator |
threshold notifiers and comparators give notes if values go over certain thresholds |

|
Total calculated design power |
After drawing in your model, the total calculated design power BC calculates total heating and cooling. |