Symbol
Parameterisation & usage
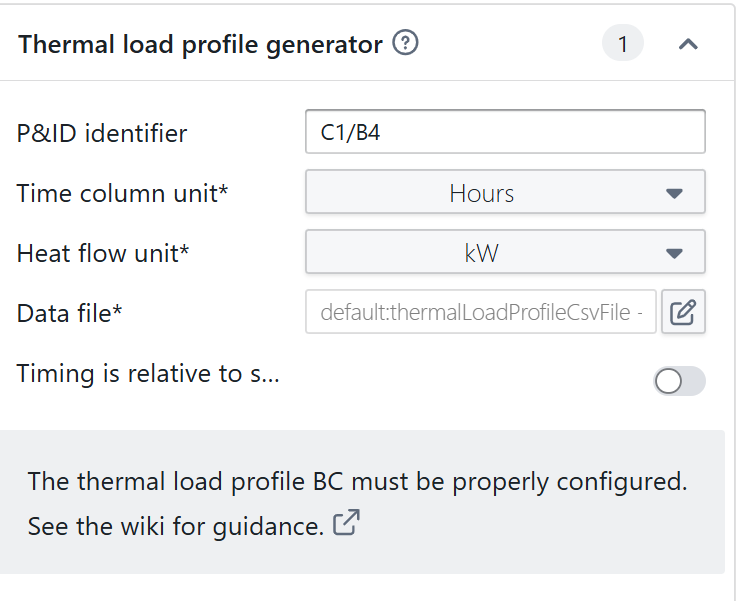
If you have yearly data, note that the “time is relative to simulation start time” should be set to “No”.
The data file needs to be provided a .csv-file or IES excel file (beta feature)
CSV file
Functional questions | What is the CSV format used by Hysopt %3F %5BinlineExtension%5D
IES excel file (beta feature)
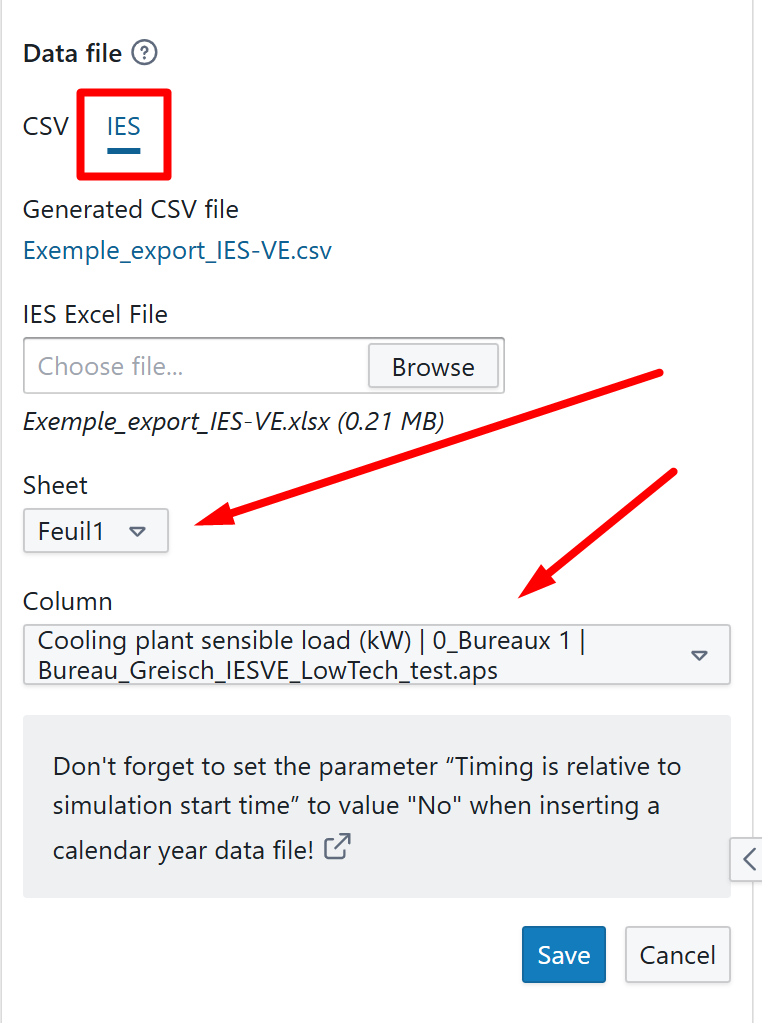
As a user you need to select the sheet and column for which you want to import the data, see screenshot
Assumptions & restrictions:
-
We tested this functionality on some of the IES files that were provided by our customers. We cannot guarantee that all IES versions are supported
-
Please contact Hysopt if you experience issues or if you have Excel files of IES that do not seem supported
-
Once uploaded, we convert the data from the excel file to our own CSV file format
-
We assume the start of the IES file time data maps to time = 0h in our CSV file, regardless of which date is listed.
-
We skip Feb 29 if present in the IES file, because Hysopt assumes non-leap years. IES data for this specific date will be ignored.
-
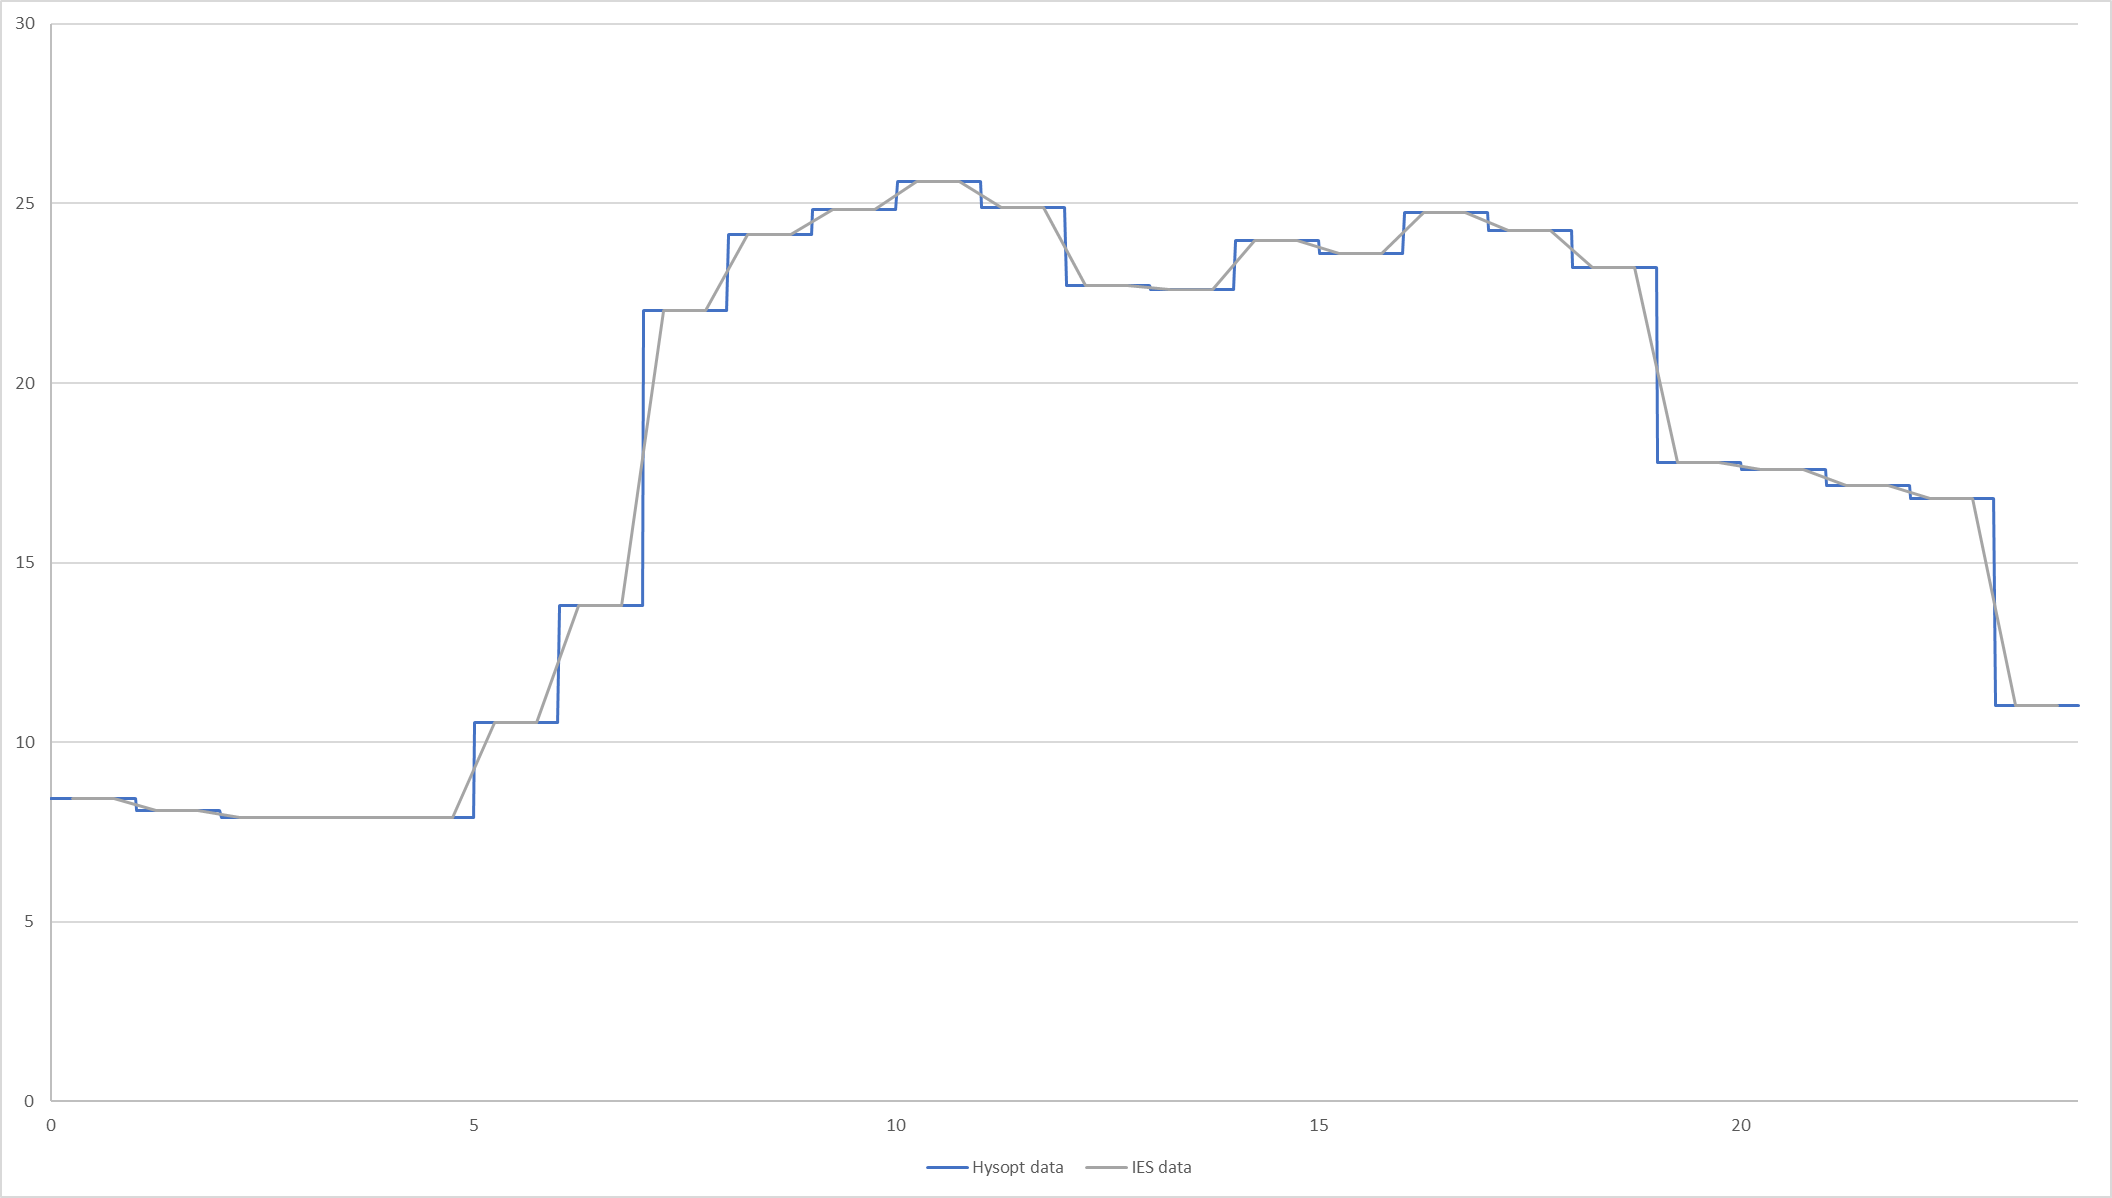
The IES files seem to contain hourly data labeled by the “middle point” of each interval, whereas our CSV file contains the start of this interval. We work around this by mapping to the start of the intervals for our CSV file. See image below for a comparison of the directly plotted IES data with the Hysopt plot data.